A Heart Rate Lesson Plan with Visible Body Suite
Posted on 7/28/23 by Laura Snider
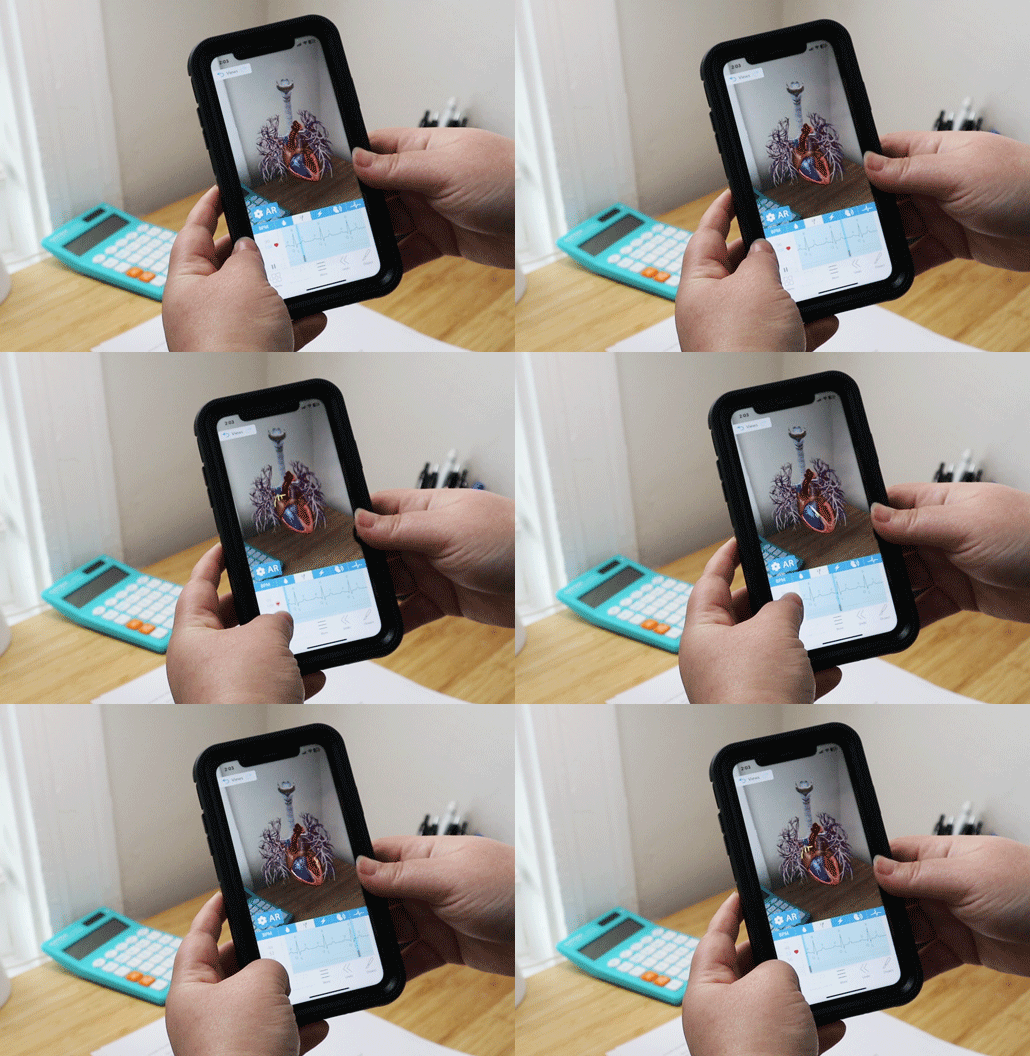
Instructors rejoice—Visible Body Suite features an interactive beating heart model!
Today, we’re going to talk you through a free lesson plan for teaching students in your classroom or lab about resting heart rate, max heart rate, and target heart rate for exercising. The first part of the class will consist of around 10 minutes of discussion and introduction, followed by a lab activity approximately 45 minutes in length.

The Visible Body Suite beating heart model in augmented reality!
For this lesson, your students can use VB Suite on a computer or on a mobile device. AR functionality is available on the VB Suite mobile app.
Click here to download a copy of this lesson plan and its corresponding worksheet.
1. Discuss resting heart rate
At the beginning of class, go over the basics of resting heart rate with your students.
One topic students might find interesting to talk about is the different factors that lead to differences in resting heart rate between people, or variations in a single person’s resting heart rate.
Some potential points for discussion include (but are certainly not limited to):
- How hormones and medication can raise or lower resting HR
- Examples: Beta-blockers lowering resting HR, an overactive thyroid raising resting HR
- How emotions such as stress and anxiety can elevate resting HR
- How resting HR varies with body position (standing vs. sitting)
- The effect of physical fitness on resting HR—why people who are extremely athletic can have a resting HR as low as 40 BPM
- Why babies and children have a higher resting HR than adults do
If you’d like to focus more on pathology, you might consider discussing with your students how bradycardia (a resting HR consistently below 60 BPM) and tachycardia (a resting HR consistently above 100 BPM) figure into heart conditions such as heart block and atrial fibrillation.
2. Have students calculate their max HR and target HR for exercise
Now that you’ve gone over the basics of resting heart rate, it’s time to talk about how to calculate max heart rate.
You can give students this basic formula: Max HR = 220 - age. So, the max HR for a student who’s 20 would be 200 BPM.
The target HR zone for getting good cardio exercise is 50-85% of max HR. So if that 20-year-old student is exercising, they’ll want to get their HR to somewhere between 100 and 170 BPM, depending on how intense a workout they want.
Remember: a person’s level of physical fitness isn’t what determines their max HR. Someone who is more physically fit will be able to spend more time working out at or close to their max HR (closer to 85% of max, rather than 50%).
3. In-class activity: have students measure and plot their heart rate
Now that students have calculated their own max HR and target HR range, they can work through the exercises on the lab activity worksheet.
And when I say exercises, I’m being literal. Essentially, the students will perform a series of actions ranging from sitting in a relaxed position to doing jumping jacks and running in place. They will record their heart rate after each action and complete a bar graph on the worksheet.
Students with injuries or other limitations to their mobility can modify the physical activities or they can team up with another student and take turns measuring that student’s HR.
During the lab activity, students can measure their HR in a number of ways.
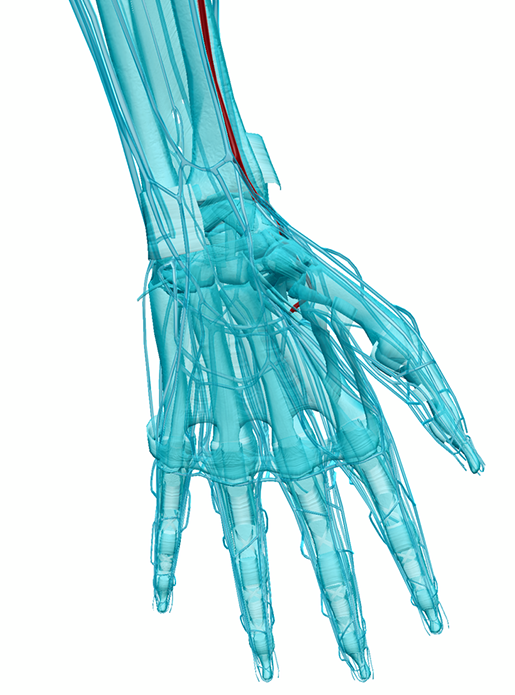
The first is the old classic—a stopwatch (or phone timer). Students will start a 30-second timer and place the tips of their pointer and middle finger on the inside of the thumb-side of their wrist. They will then count how many times their heart beats during that 30 seconds and multiply that number by 2 to figure out their BPM.

The radial artery. Image from Visible Body Suite.
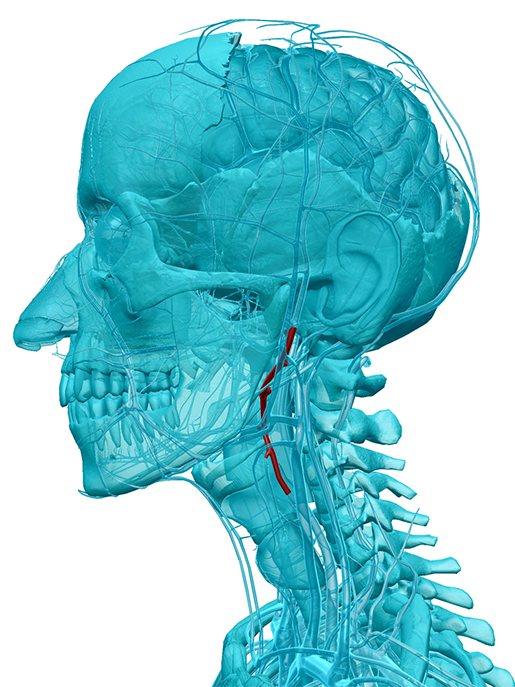
If students have trouble finding their pulse at the wrist, they can try finding their pulse at the carotid artery, near the junction of their jaw and neck, instead.
 The external carotid artery. Image from Visible Body Suite.
Students with a fitness tracker or smartwatch might want to compare the reading on their device to the stopwatch calculations—sometimes fitness trackers are not 100% accurate.
4. Show students how to visualize their own heart rate
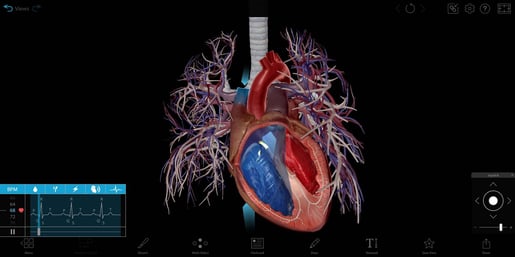
Visible Body Suite's beating heart can be used in this lab activity to help students visualize their heart’s activity at various BPM levels. The beating heart views show everything from muscle contractions and electrical activity to follow-along ECG readouts and classic lub-dub heartbeat sounds.
Students can manually select the BPM they want to view using the slider in the box at the bottom of the screen. For example, if they measured their resting HR at 68 bpm during one of the lab activity exercises, they can move the slider to 68 to see what a heart beating 68 times per minute looks like.

Image from Visible Body Suite.
5. Have students complete discussion questions
As the end of the class approaches, students will complete the discussion questions on the lab activity worksheet. Depending on how many students are in your class, you can discuss the answers to these questions together or have students share their answers in pairs or small groups.
And there you go—a quick and easy lesson on how the heart adjusts to physical activity!
To save you the time of having to scroll back to the top of the page, here is where you can get the lesson plan and activity worksheet. Happy teaching!
Be sure to subscribe to the Visible Body Blog for more anatomy awesomeness!
Are you an instructor? We have award-winning 3D products and resources for your anatomy and physiology course! Learn more here.


